How Data Analytics & Business Intelligence Can Drive Better Decisions
Across many workplaces, information keeps piling up in surprising ways old spreadsheets here, reports sitting in mailboxes, dashboards from tools used half-heartedly, and countless notes collected during busy days. After a while, the volume becomes difficult to untangle. In the middle of all this clutter, data analytics and business intelligence (BI) offer a more grounded way of making sense of scattered details. Not as flashy concepts, but as steady additions that bring a bit more order to everyday thinking.
Modern environments shift faster than earlier decades. Gut-based choices often fall short, especially when competitive changes appear without warning. Tools built around structured analysis help cut through confusion. Data analytics digs through information to reveal patterns that don’t surface easily. Business intelligence then wraps these findings into dashboards, summaries, or small panels that make the situation easier to read. The combined effect often gives decision-makers a cleaner picture without demanding complete system overhauls.
Understanding Data Analytics & Business Intelligence
Data analytics studies raw information from different sources sales, customer queries, operations logs, financial reports and picks out behaviours that repeat. A busy season here, a slow trend there, an unexpected rise from a particular segment. Some patterns stay subtle until analysed from multiple angles.
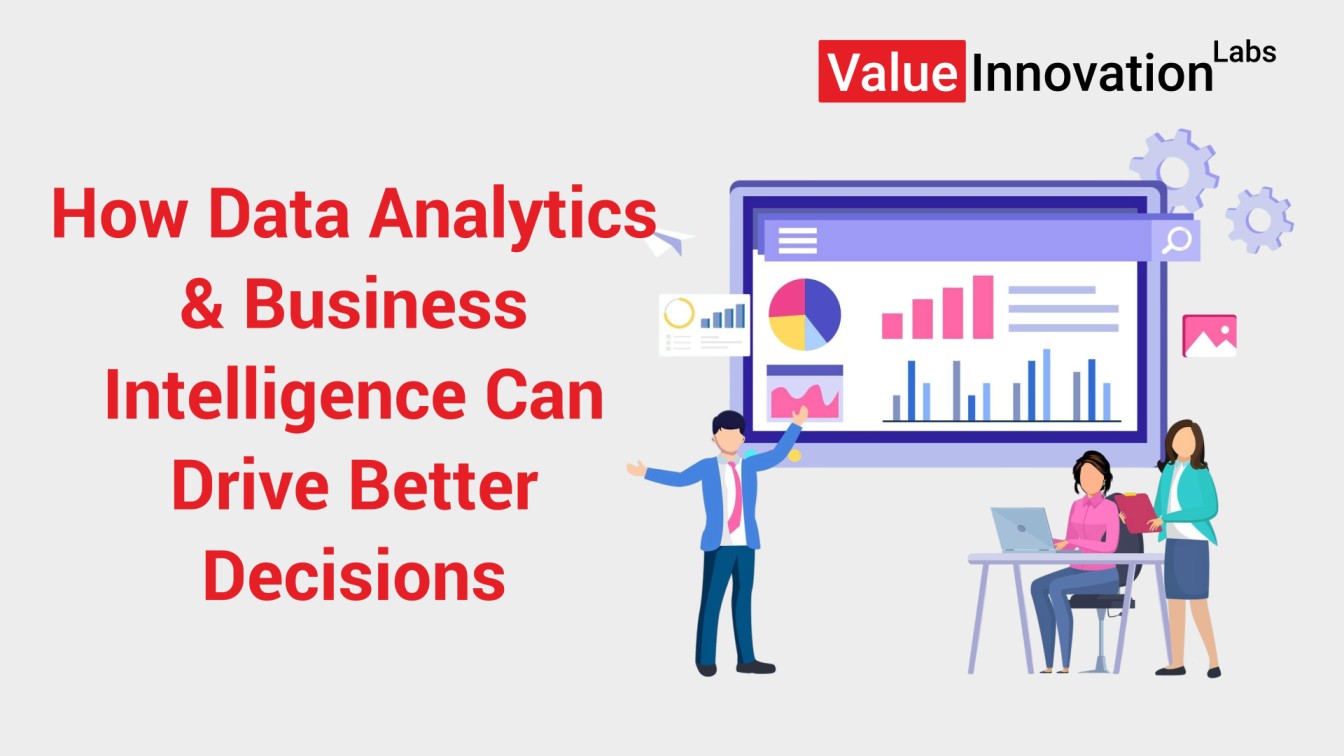
Business intelligence, meanwhile, builds a frame around all this. Instead of separate sheets and scattered databases, BI pulls information into one space. Dashboards become a quick glance rather than a long search. Charts, comparisons, timelines, and metrics help teams notice connections that normally stay hidden.
Together, the two offer:
- clarity in performance
- better forecasting
- real-time indicators
- fewer blind spots
- more grounded planning
Why Decision-Makers Depend on Analytics & BI
1. Wider Visibility Across Departments
Operations, finance, HR, sales each carries its own data. Once BI merges everything, gaps and overlaps appear more clearly. The overall movement of the organisation becomes easier to observe, almost like switching from a stack of papers to a full map.
2. Early Warning Signals
Predictive parts of data analytics highlight what might unfold ahead demand spikes, seasonal changes, service delays, or declining interest. Early signs reduce the chance of last-minute responses.
3. New Possibilities for Growth
Sometimes opportunities hide in plain sight. Certain customer segments behaving differently, products performing better in certain regions, or service issues repeating at specific points. Analytics shines a light on these repeating stories.
4. Quicker Decision Rounds
Once dashboards show accurate details, long debates shorten naturally. Decisions move faster because the numbers stand in front without guesswork.
5. Smarter Cost Distribution
Analytics exposes repetitive spending, unused resources, and inefficient loops. These insights help organisations restructure expenses without relying on assumptions.
How Analytics & BI Shift Everyday Business Functions
Marketing
- Better segmentation
- Improved campaign timing
- Cleaner measurement of engagement
- Higher clarity in budget planning
Sales
- Detailed tracking of leads
- Region-wise comparisons
- Stronger forecasting
- Identification of profit pockets
Operations
- Inventory accuracy
- Supply chain movement
- Downtime alerts
- Waste reduction
Finance
- Real-time cash visibility
- Spending patterns
- Compliance tracking
- More transparent risk outlook
Human Resources
- Skill mapping
- Workforce planning
- Productivity patterns
- Early attrition trends
How Organisations Can Begin With Analytics & BI
1. Define the Purpose Clearly
Before tools enter the system, clarity helps. Whether the goal is faster processes, customer understanding, revenue improvement, or cost control, the direction guides the analytics plan.
- Build Reliable Data Sources
Insights fail when data stays messy. Consistent formats, validated entries, and structured storage become essential for accurate interpretation.
3. Choose Scalable Tools Over Complex Ones
Tools that adapt to growth and connect with existing systems create fewer hurdles. Simpler setups often bring better long-term results.
4. Encourage Data-Oriented Habits
Dashboards must become everyday touchpoints. Once teams check them regularly, planning naturally aligns with real numbers rather than assumptions.
5. Keep Reviewing and Updating
Business needs shift, which means dashboards, KPIs, and rules should evolve too. Regular review keeps the system fresh instead of outdated.
Why This Approach Matters for the Future
A strong analytical base protects organisations from sudden turns in customer behaviour, market changes, or operational challenges. Structured insight helps in uncertain situations where instinct alone cannot provide direction. Data analytics and business intelligence become long-term companions, shaping decisions with clarity and reducing the impact of surprise events. Over time, these systems create a rhythm where decisions feel more confident and less dependent on luck.
FAQs
1. What separates data analytics from business intelligence?
Data analytics focuses on exploring deeper patterns, predictions, and relationships, while business intelligence arranges this information into readable dashboards.
2. Which industries gain the strongest impact from analytics and BI?
Sectors such as retail, finance, healthcare, logistics, manufacturing, education, and technology show significant improvement through structured insights.
3. How exactly does BI support better decisions?
BI gathers information from multiple sources and displays it in quick, clear formats, removing confusion and helping leaders act with more clarity.
Across many workplaces, information keeps piling up in surprising ways old spreadsheets here, reports sitting in mailboxes, dashboards from tools…